Page 30 - Mathematics_Form_3
P. 30

Relations


                            y                          Example 1.27
                            3
                                                       Draw the graph of the inverse of the
                                   y = x
                            2                          relation  R  =   {(x, y ) : y  =  3x} .

          FOR ONLINE READING ONLY
                            1                          Solution
                                                       From the equation  y  =  3x,  interchange
                  -2   -1   0     1    2    3   x      the variables x and y to obtain  x  =  3y.
                          -1                           Writing y in terms of x, gives  y  =        .
                                                                                         x _
                                                                                         3
                                                                                  x _
                                                                −1
                          -2                           Hence,   R       =   (x, y ) : y  =            and its
                                                                     {
                                                                                   }
                                                                                 3
                                                       graph is shown in the following figure.
                          -3
                                                                        y
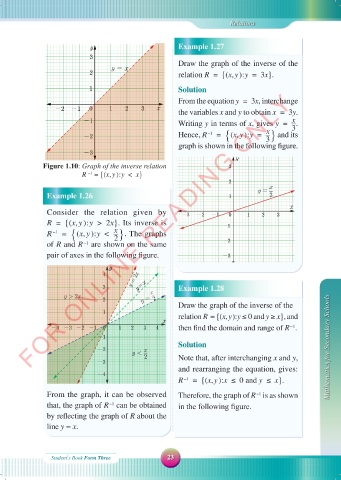
              Figure 1.10:  Graph of the inverse relation             3
                            –1
                          R   =   {(x, y ) : y  <  x}
                                                                      2
                                                                                  x
                                                                               y =
               Example 1.26                                           1           3
                                                                                         x
               Consider the relation given by           -3  -2   -1   0     1   2    3
               R  =   {(x, y ) : y  >  2x} . Its inverse is                                            -1

                                   x _
               R       =   (x, y ) : y  <          .  The graphs
                 −1
                      {
                                     }
                                   2
               of R and   R       are shown on the same             -2
                          −1
               pair of axes in the following figure.                -3
                                  y
                                4
                                           y=x
                                3                      Example 1.28
                                2
                                                       Draw the graph of the inverse of the
                                1                      relation   R    =   {(x, y ): y ≤ 0 and y ≥ x} ,  and

                                                  x

                                                                                         −1
                -4 -3 -2 -1     0    1   2  3   4      then find the domain and range of  R      .
                              -1
                                                       Solution
                              -2                                                                    Mathematics for Secondary Schools
                                                       Note that, after interchanging  x  and y,
                              -3
                                                       and rearranging the equation, gives:
                              -4
                                                       R       =   {(x, y ): x  ≤  0 and y  ≤  x} .
                                                         −1
               From the graph, it can be observed      Therefore, the graph of   R       is as shown
                                                                               −1
               that, the graph of   R       can be obtained   in the following figure.
                                  −1
               by reflecting the graph of R about the
               line y = x.


                 Student\s Book Form Three          23


                                                                                          18/09/2025   09:58:46
     MATHEMATIC F3 SB.indd   23                                                           18/09/2025   09:58:46
     MATHEMATIC F3 SB.indd   23
   25   26   27   28   29   30   31   32   33   34   35