
Page 168 - Physics
P. 168
Physics for Secondary Schools
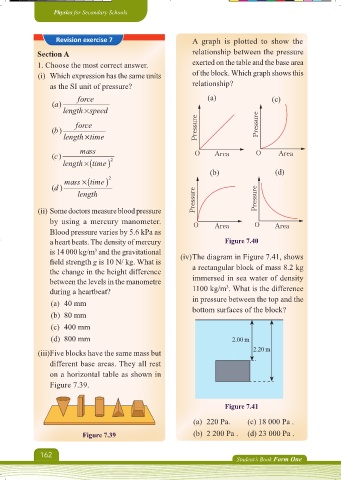
Revision exercise 7 A graph is plotted to show the
Section A relationship between the pressure
1. Choose the most correct answer. exerted on the table and the base area
(i) Which expression has the same units of the block. Which graph shows this
as the SI unit of pressure? relationship?
force (a) (c)
()a
length speed
force Pressure
()b Pressure
length time
mass
()c O Area O Area
length time 2
(b) (d)
mass time 2
()d
length Pressure Pressure
(ii) Some doctors measure blood pressure
by using a mercury manometer. O Area O Area
Blood pressure varies by 5.6 kPa as
a heart beats. The density of mercury Figure 7.40
is 14 000 kg/m and the gravitational (iv) The diagram in Figure 7.41, shows
3
fi eld strength g is 10 N/ kg. What is
the change in the height difference a rectangular block of mass 8.2 kg
between the levels in the manometre immersed in sea water of density
3
during a heartbeat? 1100 kg/m . What is the difference
(a) 40 mm in pressure between the top and the
(b) 80 mm bottom surfaces of the block?
(c) 400 mm
(d) 800 mm 2.00 m
(iii) Five blocks have the same mass but 2.20 m
different base areas. They all rest
on a horizontal table as shown in
Figure 7.39.
Figure 7.41
(a) 220 Pa. (c) 18 000 Pa .
Figure 7.39 (b) 2 200 Pa . (d) 23 000 Pa .
162
Student’s Book Form One
Physics Form 1 Final.indd 162 16/10/2024 20:57