
Page 200 - Physics
P. 200
Physics for Secondary Schools
Section B
3. A car begins to move. It speeds up until it reaches a constant speed. It continues
to travel at this constant speed for the rest of the journey.
(a) Draw the velocity-time graph to illustrate the motion
(b) What happens to the acceleration and what happens to the velocity of the car
during the journey?
(c) A drunkard walking on a narrow path takes 8 steps forward and 6 steps
backwards, followed again by 7 steps forward and 5 steps backward, and so
on. Each step is 0.8 m long and requires 45 s. Plot the x-t graph of his motion.
Determine graphically and otherwise how long the drunkard takes to fall in
a pit 13 m away from the start.
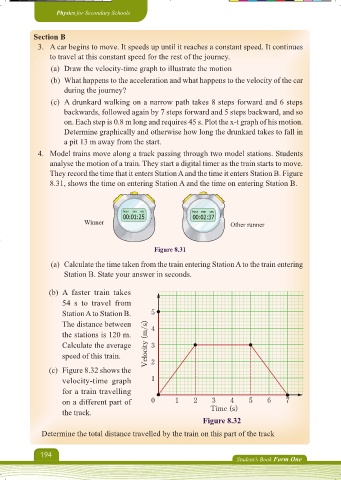
4. Model trains move along a track passing through two model stations. Students
analyse the motion of a train. They start a digital timer as the train starts to move.
They record the time that it enters Station A and the time it enters Station B. Figure
8.31, shows the time on entering Station A and the time on entering Station B.A and the time on entering Station B.
8.31, shows the time on entering Station
Winner Other runner
Figure 8.31
(a) Calculate the time taken from the train entering Station A to the train entering
Station B. State your answer in seconds.
(b) A faster train takes
54 s to travel from
Station A to Station B. 5
The distance between 4 4
the stations is 120 m.
Calculate the average Velocity (m/s) 3 3
speed of this train. 2
(c) Figure 8.32 shows the
velocity-time graph 1
for a train travelling
on a different part of 0 1 2 3 4 5 6 7 7
the track. Time (s)
Figure 8.32
Determine the total distance travelled by the train on this part of the track
194
Student’s Book Form One
Physics Form 1 Final.indd 194 16/10/2024 20:58