
Page 202 - Physics
P. 202
Physics for Secondary Schools
7. (a) Figure 8.34, represents the corresponding acceleration-
position-time graph for two time graph.
students R and S returning from (b) Find its:
their school located at O to their (i) Acceleration;
homes A and B, respectively. (ii) Retardation; and
(iii) Maximum speed it attains
y
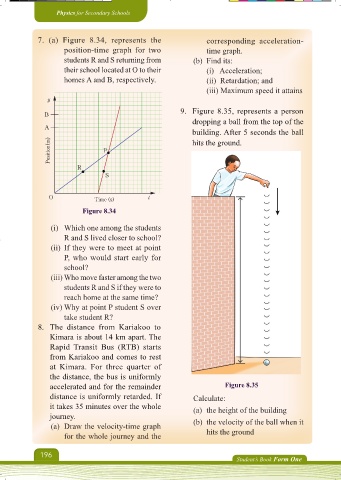
9. Figure 8.35, represents a person
B
dropping a ball from the top of the
A
building. After 5 seconds the ball
Position(m) P hits the ground.
R
S
O Time (s) t
Figure 8.34
(i) Which one among the students
R and S lived closer to school?
(ii) If they were to meet at point
P, who would start early for
school?
(iii) Who move faster among the two
students R and S if they were to
reach home at the same time?
(iv) Why at point P student S over
take student R?
8. The distance from Kariakoo to
Kimara is about 14 km apart. The
Rapid Transit Bus (RTB) starts
from Kariakoo and comes to rest
at Kimara. For three quarter of
the distance, the bus is uniformly
accelerated and for the remainder Figure 8.35
distance is uniformly retarded. If Calculate:
it takes 35 minutes over the whole (a) the height of the building
journey.
(a) Draw the velocity-time graph (b) the velocity of the ball when it
for the whole journey and the hits the ground
196
Student’s Book Form One
Physics Form 1 Final.indd 196 16/10/2024 20:58