
Page 15 - Mathematics_Form_3
P. 15
Relations
Example 1.7 pair (x , ) y as a point in the xy-plane. If
the relation R has an infinite number of
Let R = { (4, 16), (4, 20), (5, 20), (8, 16),
(9, 18)}. elements (pairs), tabulate a few values
of x with their corresponding values of
(a) Express R in tabular form.
y and use the values to draw the graph
FOR ONLINE READING ONLY
(b) Write a relationship between the of the relation. In this case, the domain
set of ordered pairs of relation R. and range of the relation can be obtained
(c) Find the domain and range of R. from the graph.
Solution
(a) The relation R can be expressed Example 1.8
in tabular form as shown in the
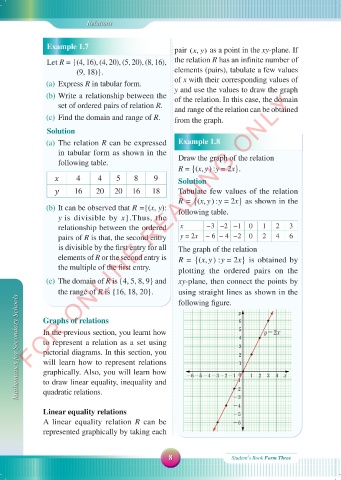
following table. Draw the graph of the relation
R = {(x, y ) : y = 2x} .
4 4 5 8 9 Solution
16 20 20 16 18 Tabulate few values of the relation
R = {(x, y ) : y = 2x} as shown in the
(b) It can be observed that R = {(x, y): following table.
y is divisible by x}.Thus, the
relationship between the ordered x − 3 − 2 − 1 0 1 2 3
pairs of R is that, the second entry y = 2x − 6 − 4 − 2 0 2 4 6
is divisible by the first entry for all The graph of the relation
elements of R or the second entry is R = {(x, y ) : y = 2x} is obtained by
the multiple of the first entry. plotting the ordered pairs on the
(c) The domain of R is {4, 5, 8, 9} and xy- plane, then connect the points by
the range of R is {16, 18, 20}. using straight lines as shown in the
Mathematics for Secondary Schools Graphs of relations -6-5 -4-3-2-1 0 6 5 4 3 2 1 1 2 y=2x x
following figure.
y
In the previous section, you learnt how
to represent a relation as a set using
pictorial diagrams. In this section, you
will learn how to represent relations
graphically. Also, you will learn how
3
4
-1
to draw linear equality, inequality and
-2
quadratic relations.
-3
-4
Linear equality relations -5
A linear equality relation R can be -6
represented graphically by taking each
8 Student\s Book Form Three
18/09/2025 09:58:37
MATHEMATIC F3 SB.indd 8
MATHEMATIC F3 SB.indd 8 18/09/2025 09:58:37