
Page 16 - Mathematics_Form_3
P. 16
Relations
Example 1.9 3
3. R = ( , ):xy y = − x + 1
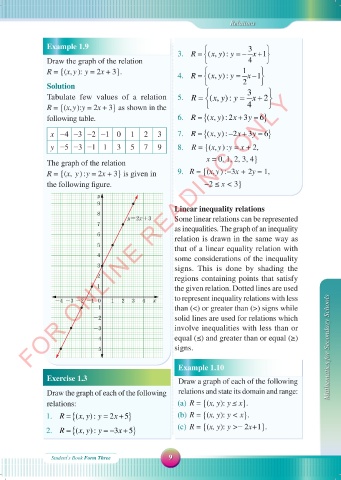
Draw the graph of the relation 4
R = {(x, y ): y = 2x + 3} . 4. R = ( , ):xy y = 1 x − 1
Solution 2
FOR ONLINE READING ONLY
Tabulate few values of a relation 5. R = ( , ):xy y = 3 x + 2
R = {(x, y ): y = 2x + 3} as shown in the 4
following table. 6. R = {( , ): 2xy x + 3y = } 6
x −4 −3 −2 −1 0 1 2 3 7. R = {( , ): 2xy − x + 3y = } 6
y −5 −3 −1 1 3 5 7 9 8. R = {(x, y ) : y = x + 2,
The graph of the relation x = 0, 1, 2, 3, 4}
R = {(x, y ) : y = 2x + 3} is given in 9. R = {(x, y ) : −3x + 2y = 1,
the following figure. −2 ≤ x < 3}
y
9
Linear inequality relations
8
y=2x+3 Some linear relations can be represented
7
as inequalities. The graph of an inequality
6
relation is drawn in the same way as
5
that of a linear equality relation with
4 some considerations of the inequality
3 signs. This is done by shading the
2 regions containing points that satisfy
1 the given relation. Dotted lines are used
to represent inequality relations with less
-4 -3 -2 -1 0 1 2 3 4 x
-1 than ( < ) or greater than ( > ) signs while
-2 solid lines are used for relations which
-3 involve inequalities with less than or
-4 equal ( ≤ ) and greater than or equal ( ≥ )
-5 signs. Mathematics for Secondary Schools
Example 1.10
Exercise 1.3 Draw a graph of each of the following
Draw the graph of each of the following relations and state its domain and range:
relations: (a) R = {(x, y): y ≤ x} .
1. R = {( , ):xy y = 2x + } 5 (b) R = {(x, y): y < x} .
2. R = {( , ):xy y = − 3x + } 5 (c) R = {(x, y): y >− 2x+1} .
Student\s Book Form Three 9
18/09/2025 09:58:37
MATHEMATIC F3 SB.indd 9 18/09/2025 09:58:37
MATHEMATIC F3 SB.indd 9