
Page 21 - Mathematics_Form_3
P. 21
Relations
Quadratic relations Example 1.14
Relations can also be represented Let R = {(x, y ) : y ≤ − (x − 1) +1 and
2
by quadratic equations or quadratic y ≥ x − 6} be a relation. Draw the
inequalities.
graph of R and determine its domain
FOR ONLINE READING ONLY
and range.
Example 1.13
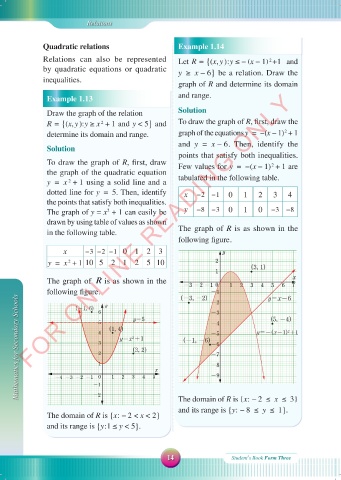
Draw the graph of the relation Solution
R = {(x, y ): y ≥ x + 1 and y < 5} and To draw the graph of R, first, draw the
2
determine its domain and range. graph of the equations y = − (x − 1) + 1
2
and y = x − 6. Then, identify the
Solution
points that satisfy both inequalities.
To draw the graph of R, first, draw Few values for y = − (x − 1) + 1 are
2
the graph of the quadratic equation
y = x + 1 using a solid line and a tabulated in the following table.
2
dotted line for y = 5. Then, identify x − 2 − 1 0 1 2 3 4
the points that satisfy both inequalities.
The graph of y = x + 1 can easily be y − 8 − 3 0 1 0 − 3 − 8
2
drawn by using table of values as shown
in the following table. The graph of R is as shown in the
following figure.
x − 3 − 2 − 1 0 1 2 3 y
y = x + 1 10 5 2 1 2 5 10 2
2
1 (3, 1)
x
The graph of R is as shown in the
-3 -2 -1 0 1 2 3 4 5 6 7
following figure. 6 y y=5 (-3, -2) -1 y=x-6
Mathematics for Secondary Schools -4 -3 -2 -1 5 4 3 2 1 0 (1, 4) 2 2 3 (3, 2) 5 x (-1, -6) -4 y=-(x-1) +1
-2
(-1, 6)
-3
(5, -4)
2
-5
y=x +1
-6
-7
-8
-9
1
4
-1
-2
The domain of is {x : − 2 ≤ x ≤ 3}
and its range is {y : − 8 ≤ y ≤ 1} .
The domain of R is {x : − 2 < x < 2}
and its range is {y : 1 ≤ y < 5} .
14 Student\s Book Form Three
18/09/2025 09:58:40
MATHEMATIC F3 SB.indd 14 18/09/2025 09:58:40
MATHEMATIC F3 SB.indd 14