
Page 22 - Physics
P. 22
Physics for Secondary Schools
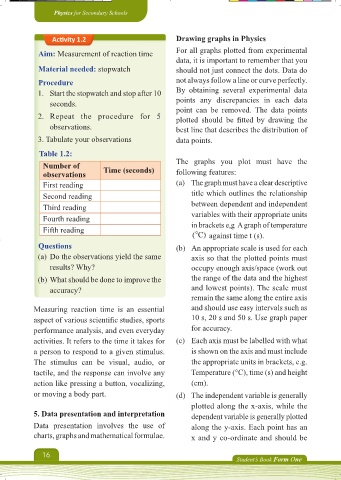
Acti vity 1.2 Drawing graphs in Physics
Aim: Measurement of reaction time For all graphs plotted from experimental
data, it is important to remember that you
Material needed: stopwatch should not just connect the dots. Data do
Procedure not always follow a line or curve perfectly.
1. Start the stopwatch and stop after 10 By obtaining several experimental data
seconds. points any discrepancies in each data
point can be removed. The data points
2. Repeat the procedure for 5 plotted should be fi tted by drawing the
observations. best line that describes the distribution of
3. Tabulate your observations data points.
Table 1.2:
Number of The graphs you plot must have the
observations Time (seconds) following features:
First reading (a) The graph must have a clear descriptive
Second reading title which outlines the relationship
Third reading between dependent and independent
Fourth reading variables with their appropriate units
Fifth reading in brackets e,g A graph of temperature
(°C) against time t (s).
Questions (b) An appropriate scale is used for each
(a) Do the observations yield the same axis so that the plotted points must
results? Why? occupy enough axis/space (work out
(b) What should be done to improve the the range of the data and the highest
accuracy? and lowest points). The scale must
remain the same along the entire axis
Measuring reaction time is an essential and should use easy intervals such as
aspect of various scientifi c studies, sports 10 s, 20 s and 50 s. Use graph paper
performance analysis, and even everyday for accuracy.
activities. It refers to the time it takes for (c) Each axis must be labelled with what
a person to respond to a given stimulus. is shown on the axis and must include
The stimulus can be visual, audio, or the appropriate units in brackets, e.g.
tactile, and the response can involve any Temperature (°C), time (s) and height
action like pressing a button, vocalizing, (cm).
or moving a body part. (d) The independent variable is generally
plotted along the x-axis, while the
5. Data presentation and interpretation dependent variable is generally plotted
Data presentation involves the use of along the y-axis. Each point has an
charts, graphs and mathematical formulae. x and y co-ordinate and should be
16
Student’s Book Form One
Physics Form 1 Final.indd 16 16/10/2024 20:55