
Page 38 - Mathematics_Form_3
P. 38
Functions
Solution Identification of a function from a
(a) F = {( 2, 6),(0, 3),(1,0),( 1,3)}−− − − graph
1 1 1 1 Graphs visually represent functions,
, 4,
(b) H = 6, making it easier to check if a relation
, 5,
, 3,
6 3 5 4
FOR ONLINE READING ONLY
(c) G = {(2,9),(1,6),(0,5),( 1,9),( 2,5)}− − satisfies the rules of a function. By
looking at the graph, it is possible to
Example 2.2 conclude whether it is a function or not
using simple tests, such as the vertical
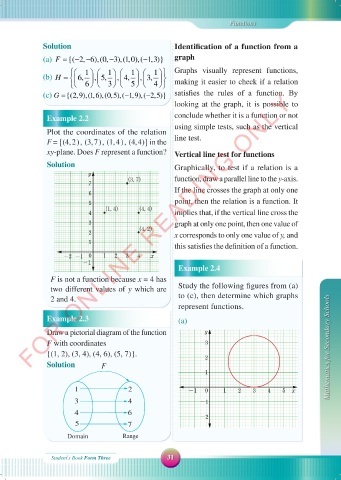
Plot the coordinates of the relation
F = {(4, 2 ) , (3, 7 ) , (1, 4 ) , (4, 4)} in the line test.
xy-plane. Does F represent a function? Vertical line test for functions
Solution Graphically, to test if a relation is a
y
(3, 7) function, draw a parallel line to the y- axis.
7
6 If the line crosses the graph at only one
5 point, then the relation is a function. It
(1, 4) (4, 4)
4 implies that, if the vertical line cross the
3 graph at only one point, then one value of
(4, 2)
2 x corresponds to only one value of y, and
1
this satisfies the definition of a function.
-2 -1 0 1 2 3 4 x
-1
Example 2.4
F is not a function because x = 4 has
two different values of y which are Study the following figures from (a)
2 and 4. to (c), then determine which graphs
represent functions.
Example 2.3 (a)
Draw a pictorial diagram of the function y
F with coordinates 3 Mathematics for Secondary Schools
{(1, 2), (3, 4), (4, 6), (5, 7)}.
2
Solution F
1
1 2 -1 0 1 2 3 4 5 x
3 4 -1
4 6 -2
5 7
Domain Range
Student\s Book Form Three 31
18/09/2025 09:58:50
MATHEMATIC F3 SB.indd 31 18/09/2025 09:58:50
MATHEMATIC F3 SB.indd 31