
Page 41 - Mathematics_Form_3
P. 41
Functions
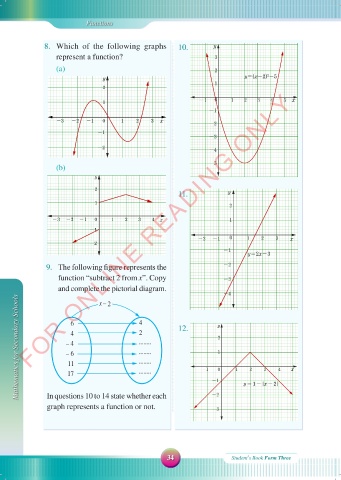
8. Which of the following graphs 10. y
represent a function? 3
(a) 2
y=(x-2) -5
2
y
1
2
FOR ONLINE READING ONLY
-1 0 0 1 2 3 4 5 x
1
-1
-3 -2 -1 0 1 2 3 x
-2
-1
-3
-2
-4
(b) -5
y
2
11. y
1
2
-3 -2 -1 0 1 2 3 4 x 1
-1
-2 -1 0 0 1 2 3 x
-2
-1
y=2x-3
9. The following figure represents the -2
function “subtract 2 from x”. Copy -3
and complete the pictorial diagram.
-4
Mathematics for Secondary Schools – 4 4 12. -1 y 2 1 0 1 2 3 4 x
x – 2
6
2
4
........
........
– 6
........
11
........
17
In questions 10 to 14 state whether each
-2
graph represents a function or not. -1 y =1-|x-2|
-3
34 Student\s Book Form Three
18/09/2025 09:58:51
MATHEMATIC F3 SB.indd 34 18/09/2025 09:58:51
MATHEMATIC F3 SB.indd 34