
Page 76 - Mathematics_Form_3
P. 76
Linear programming
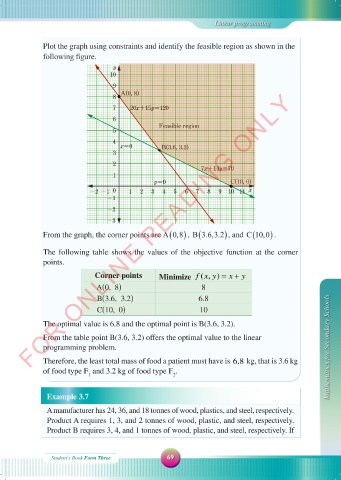
Plot the graph using constraints and identify the feasible region as shown in the
following figure.
y
10
9
FOR ONLINE READING ONLY
A(0, 8)
8
7 20x+15y=120
6
Feasible region
5
4
x=0 B(3.6, 3.2)
3
2
7x+14y=70
1
y=0 C(10, 0)
-2 -1 0 1 2 3 4 5 6 7 8 9 10 11 x
-1
-2
-3
)
C
) B
A
From the graph, the corner points are (0,8 , (3.6,3.2 , and (10,0 . )
The following table shows the values of the objective function at the corner
points.
Corner points Minimize (, )f xy = x + y
A(0, 8) 8
B(3.6, 3.2) 6.8
C(10, 0) 10
The optimal value is 6.8 and the optimal point is B(3.6, 3.2).
From the table point B(3.6, 3.2) offers the optimal value to the linear
programming problem. Mathematics for Secondary Schools
Therefore, the least total mass of food a patient must have is 6.8 kg, that is 3.6 kg
of food type F and 3.2 kg of food type F .
1 2
Example 3.7
A manufacturer has 24, 36, and 18 tonnes of wood, plastics, and steel, respectively.
Product A requires 1, 3, and 2 tonnes of wood, plastic, and steel, respectively.
Product B requires 3, 4, and 1 tonnes of wood, plastic, and steel, respectively. If
Student\s Book Form Three 69
18/09/2025 09:59:11
MATHEMATIC F3 SB.indd 69
MATHEMATIC F3 SB.indd 69 18/09/2025 09:59:11