
Page 156 - Mathematics_F1
P. 156
Example 6.25
Draw the graph of the equation y − 2x = 2.
Solution
FOR ONLINE READING ONLY
Given the equation y − 2x = 2 Re-write the equation in the form y = mx + . c Tanzania Institute of Education
That is, y = 2x + 2.
2
The table of values for y = 2x + is as follows:
x 2 − − 1 0 1
y 2 − 0 2 4
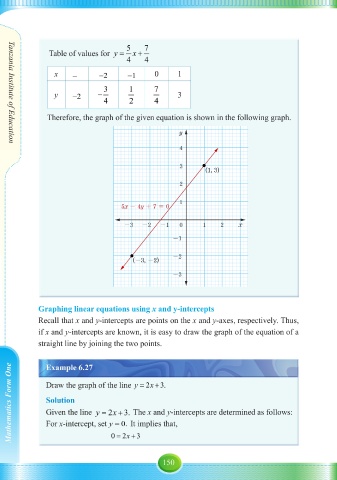
Therefore, the graph of the given equation is illustrated in the following figure.
y
4 (1, 4)
3
(0, 2)
2
y - 2x = 2
1
(-1, 0)
-3 -2 -1 0 1 2 3 x
-1
(-2, -2)
-2
Example 6.26
7 0.
Draw the graph of the equation 5x − 4y +=
Solution
7 0. Re-write the equation in the form y =
Given 5x − 4y += mx + . c
5 7 Mathematics Form One
That is y = x + .
4 4
149
25/09/2025 15:01:49
Mathematics form 1.indd 149 25/09/2025 15:01:49
Mathematics form 1.indd 149