
Page 179 - Physics
P. 179
Linear motion
magnitude of the velocity will increase. (20 m/s – 5m/s )
If the acceleration and velocity are in = 3s
opposite directions, the magnitude of the 15 m/s
velocity will decrease. =
3 s
Example 8.4 = 5 m/s 2
An object is initially moving at This means the car accelerates or
2
15 m/s to the right. Eight seconds later, speeds up by 5 m/s every second.
it is moved at 5 m/s to the left. During
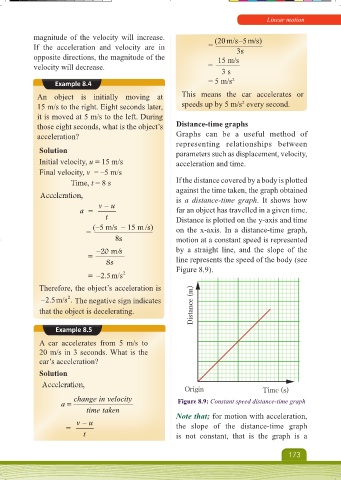
those eight seconds, what is the object’s Distance-time graphs
acceleration? Graphs can be a useful method of
representing relationships between
Solution parameters such as displacement, velocity,
Initial velocity, u = 15 m/s acceleration and time.
Final velocity, v = –5 m/s
Time, t = 8 s If the distance covered by a body is plotted
against the time taken, the graph obtained
Acceleration, is a distance-time graph. It shows how
v – u
a = far an object has travelled in a given time.
t Distance is plotted on the y-axis and time
(–5 m/s – 15 m /s)
= on the x-axis. In a distance-time graph,
8s motion at a constant speed is represented
–20 m/s by a straight line, and the slope of the
= line represents the speed of the body (see
8s
Figure 8.9).
= 2.5m/s= -
–20 m/s 2
8s
Therefore, the object’s acceleration is
- 2.5m/s 2 . The negative sign indicates
that the object is decelerating. Distance (m)
Example 8.5
A car accelerates from 5 m/s to
20 m/s in 3 seconds. What is the
car’s acceleration?
Solution
Acceleration,
Origin Time (s)
change in velocity
a = Figure 8.9: Constant speed distance-time graph
time taken
v – u Note that; for motion with acceleration,
= the slope of the distance-time graph
t is not constant, that is the graph is a
173
Physics Form 1 Final.indd 173 16/10/2024 20:58