Page 181 - Physics
P. 181

Linear motion

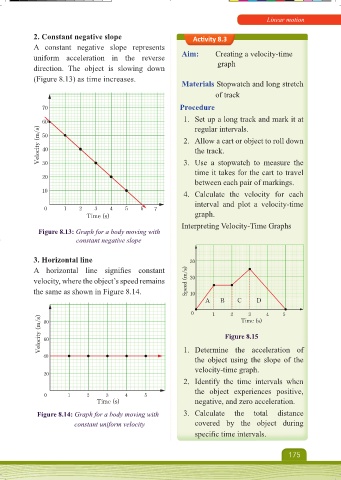
           2. Constant negative slope                      Acti vity 8.3
           A constant negative  slope represents
           uniform  acceleration  in  the  reverse      Aim:      Creating a velocity-time
           direction.  The object  is slowing down                 graph
           (Figure 8.13) as time increases.
                                                        Materials Stopwatch and long stretch
                                                                  of track

              70                                       Procedure
                                                         1.  Set up a long track and mark it at
              60                                            regular intervals.
             Velocity (m/s)  50                          2.  Allow a cart or object to roll down


                                                            the track.
              40
                                                         3.  Use a stopwatch to measure the
              30
                                                            time it takes for the cart to travel
              20
                                                            between each pair of markings.
              10
                                                         4.  Calculate  the velocity  for each
                                                            interval  and plot a velocity-time
              0     1    2    3   4    5    6   7
                           Time (s)                         graph.
                                                        Interpreting Velocity-Time Graphs
             Figure 8.13: Graph for a body moving with
                         constant negative slope


           3. Horizontal line                             30
           A  horizontal  line  signifi es  constant
           velocity, where the object’s speed remains    Speed (m/s)  20
           the same as shown in Figure 8.14.              10
                                                               A    B    C     D

                                                           0     1     2  Time (s)     4  5
                                                                            3
             Velocity (m/s)  60                                      Figure 8.15
              80


              40                                         1.  Determine the acceleration of
                                                            the  object  using  the  slope of the
                                                            velocity-time graph.
              20
                                                         2.  Identify  the  time  intervals  when
                                                            the object experiences positive,
              0       1    2     3     4     5
                              Time (s)                      negative, and zero acceleration.
             Figure 8.14: Graph for a body moving with     3.  Calculate  the  total  distance
                        constant uniform velocity           covered by the object  during
                                                            specifi c time intervals.


                                                                                        175


     Physics Form 1 Final.indd   175                                                        16/10/2024   20:58
   176   177   178   179   180   181   182   183   184   185   186