
Page 180 - Physics
P. 180
Physics for Secondary Schools
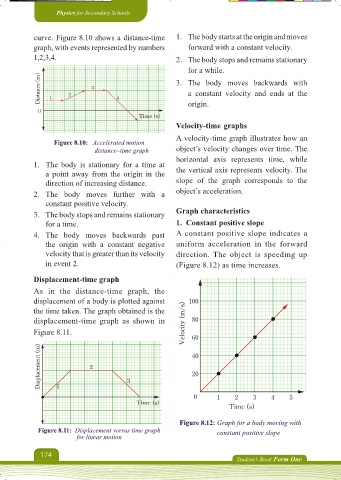
curve. Figure 8.10 shows a distance-time 1. The body starts at the origin and moves
graph, with events represented by numbers forward with a constant velocity.
1,2,3,4. 2. The body stops and remains stationary
for a while.
Distance (m) 1 2 3 4 3. The body moves backwards with
a constant velocity and ends at the
O origin.
Time (s)
Velocity-time graphs
A velocity-time graph illustrates how an
Figure 8.10: Accelerated motion
distance–time graph object’s velocity changes over time. The
horizontal axis represents time, while
1. The body is stationary for a time at
a point away from the origin in the the vertical axis represents velocity. The
direction of increasing distance. slope of the graph corresponds to the
2. The body moves further with a object’s acceleration.
constant positive velocity.
3. The body stops and remains stationary Graph characteristics
for a time. 1. Constant positive slope
4. The body moves backwards past A constant positive slope indicates a
the origin with a constant negative uniform acceleration in the forward
velocity that is greater than its velocity direction. The object is speeding up
in event 2. (Figure 8.12) as time increases.
Displacement-time graph
As in the distance-time graph, the
displacement of a body is plotted against 100
the time taken. The graph obtained is the
displacement-time graph as shown in Velocity (m/s) 80
Figure 8.11. 60
Displacement (m) 2 3 40
20
1
0 1 2 3 4 5
Time (s)
Time (s)
Figure 8.12: Graph for a body moving with
Figure 8.11: Displacement versus time graph constant positive slope
for linear motion
174
Student’s Book Form One
Physics Form 1 Final.indd 174 16/10/2024 20:58