
Page 184 - Physics
P. 184
Physics for Secondary Schools
The area covered under a
velocity-time graph represents the
displacement. 1
Therefore, Acceleration (m/s 2 )
total displacement =120 m + 300 m
= 420 m
Note: The distance travelled is 2 Time (s)
represented by the area under a
velocity–time curve and the time axis
irrespective of the shape of the curve.
3
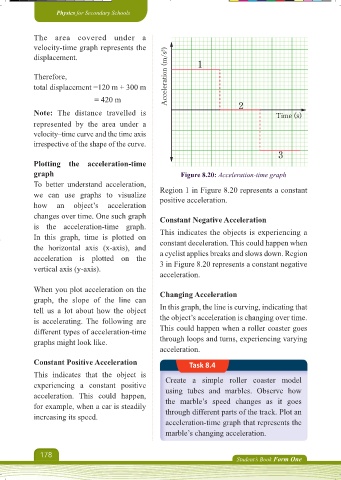
Plotting the acceleration-time
graph Figure 8.20: Acceleration-time graph
To better understand acceleration,
we can use graphs to visualize Region 1 in Figure 8.20 represents a constant
positive acceleration.
how an object’s acceleration
changes over time. One such graph Constant Negative Acceleration
is the acceleration-time graph.
In this graph, time is plotted on This indicates the objects is experiencing a
the horizontal axis (x-axis), and constant deceleration. This could happen when
acceleration is plotted on the a cyclist applies breaks and slows down. Region
vertical axis (y-axis). 3 in Figure 8.20 represents a constant negative
acceleration.
When you plot acceleration on the Changing Acceleration
graph, the slope of the line can
tell us a lot about how the object In this graph, the line is curving, indicating that
is accelerating. The following are the object’s acceleration is changing over time.
different types of acceleration-time This could happen when a roller coaster goes
graphs might look like. through loops and turns, experiencing varying
acceleration.
Constant Positive Acceleration Task 8.4
This indicates that the object is Create a simple roller coaster model
experiencing a constant positive using tubes and marbles. Observe how
acceleration. This could happen, the marble’s speed changes as it goes
for example, when a car is steadily through different parts of the track. Plot an
increasing its speed.
acceleration-time graph that represents the
marble’s changing acceleration.
178
Student’s Book Form One
Physics Form 1 Final.indd 178 16/10/2024 20:58