
Page 60 - Mathematics_Form_3
P. 60
Functions
Solution y
Let y = f (x). 4
The table of values of y = x is as 3
shown in the following table. 2 f(x)=|x-3|
FOR ONLINE READING ONLY
x − 1 0 1 2 3 1
y 1 0 1 2 3 x
-1 0 1 2 3 4 5
The graph of ()fx = x is as shown -1
in the following figure.
y Domain = {x : x ∈ ℝ} and
3
range = {y : y ≥ 0} .
f(x)=|x|
2
Example 2.28
1
Sketch the graph of ()fx = x + 1 and
x
-3 -2 -1 0 1 2 3 give its domain and range.
-1 Solution
Let y = f (x).
The table of values of y = x + 1 is
Domain { :xx= ∈ } and
shown as follows.
range { :yy= ≥ } 0 . x − 2 − 1 0 1 2 3
y 3 2 1 2 3 4
The graph of y = x + 1is shown in the
Example 2.27 following figure.
|
|
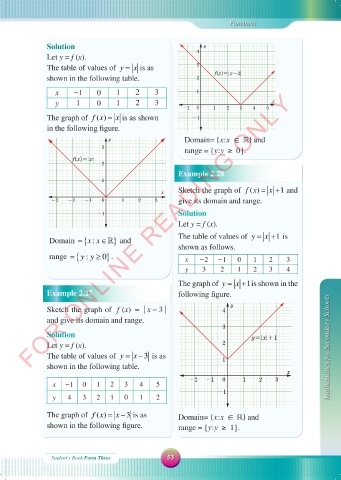
Sketch the graph of f (x) = x − 3 4 y
and give its domain and range.
3
Solution y=|x|+1
Let y = f (x). 2 Mathematics for Secondary Schools
The table of values of y = x − 3 is as 1
shown in the following table.
x
x − 1 0 1 2 3 4 5 -2 -1 0 1 2 3
-1
y 4 3 2 1 0 1 2
The graph of ()fx = x − 3 is as Domain = {x : x ∈ ℝ} and
shown in the following figure. range = {y : y ≥ 1} .
Student\s Book Form Three 53
18/09/2025 09:59:01
MATHEMATIC F3 SB.indd 53
MATHEMATIC F3 SB.indd 53 18/09/2025 09:59:01