
Page 56 - Mathematics_Form_3
P. 56
Functions
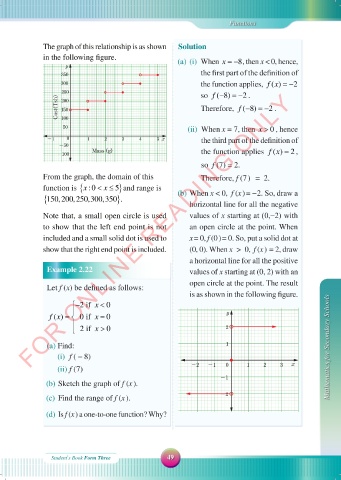
The graph of this relationship is as shown Solution
in the following figure. (a) (i) When x = − 8, then x < 0, hence,
y
350 the first part of the definition of
300 the function applies, ()fx = − 2
FOR ONLINE READING ONLY
250 so ( 8)f − = − 2 .
Cost(Tsh) 150 Therefore, ( 8)f − = − 2 .
200
100
0
50 (ii) When x = 7, then x > , hence
-1 0 1 2 3 4 5 x the third part of the definition of
-50
2
Mass (g) the function applies ()fx = ,
-100
so f (7) = 2.
From the graph, the domain of this Therefore, f (7 ) = 2.
function is { :0x <≤ } 5 and range is (b) When x < 0 , f (x ) = − 2 . So, draw a
x
{150,200,250,300,350 }.
horizontal line for all the negative
Note that, a small open circle is used values of x starting at (0,−2) with
to show that the left end point is not an open circle at the point. When
included and a small solid dot is used to x = 0 , f (0 ) = 0. So, put a solid dot at
show that the right end point is included. (0, 0). When x > 0, f (x ) = 2 , draw
a horizontal line for all the positive
Example 2.22 values of x starting at (0, 2) with an
open circle at the point. The result
Let f (x) be defined as follows:
is as shown in the following figure.
− 2 if x < 0
fx 0 if x = 0 y
( ) =
2 if x > 0 2
(a) Find: 1 Mathematics for Secondary Schools
(i) f ( − 8)
-2 -1 0 1 2 3 x
(ii) f (7)
-1
(b) Sketch the graph of f (x ).
-2
(c) Find the range of f (x ).
(d) Is f (x ) a one-to-one function? Why?
Student\s Book Form Three 49
18/09/2025 09:58:59
MATHEMATIC F3 SB.indd 49 18/09/2025 09:58:59
MATHEMATIC F3 SB.indd 49