
Page 53 - Mathematics_Form_3
P. 53
Functions
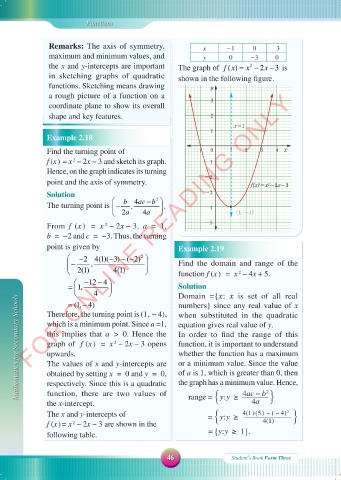
Remarks: The axis of symmetry, x − 1 0 3
maximum and minimum values, and y 0 − 3 0
the x and y -intercepts are important The graph of ()fx = x − 2 2x − 3 is
in sketching graphs of quadratic shown in the following figure.
functions. Sketching means drawing y
FOR ONLINE READING ONLY
a rough picture of a function on a
coordinate plane to show its overall 3
shape and key features. 2
x=1
1
Example 2.18
Find the turning point of -1 0 1 1 2 3 4 x
f (x ) = x − 2x − 3 and sketch its graph. -1
2
Hence, on the graph indicates its turning
point and the axis of symmetry. -2
2
f(x)=x -2x-3
Solution 2 -3
The turning point is = − b , 4ac b − . -4
2a 4a (1, -4)
From f (x ) = x − 2x − 3 , a = 1, -5
2
b = − 2 and c = − 3 . Thus, the turning
point is given by Example 2.19
− 2 4(1)( 3) ( 2) − − − 2
= − , Find the domain and range of the
2(1) 4(1) function f (x ) = x − 4x + 5.
2
− 12 4−
= 1, Solution
= (1, 4)− 4 Domain ={ : is set of all real
Mathematics for Secondary Schools which is a minimum point. Since a =1, equation gives real value of y.
numbers} since any real value of x
Therefore, the turning point is (1, − 4) ,
when substituted in the quadratic
this implies that a > 0. Hence the
In order to find the range of this
graph of f (x ) = x − 2x − 3 opens
2
function, it is important to understand
upwards.
whether the function has a maximum
The values of x and y -intercepts are
or a minimum value. Since the value
obtained by setting x = 0 and y = 0,
of a is 1, which is greater than 0, then
respectively. Since this is a quadratic
function, there are two values of
4ac − b
2
_
range = y : y ≥
{
}
the x -intercept. the graph has a minimum value. Hence,
4a
The x and y -intercepts of = y : y ≥ 4(1 ) (5 ) − ( − 4)
2
____________
f (x ) = x − 2x − 3 are shown in the { 4(1) }
2
= {y : y ≥ 1} .
following table.
46 Student\s Book Form Three
18/09/2025 09:58:57
MATHEMATIC F3 SB.indd 46
MATHEMATIC F3 SB.indd 46 18/09/2025 09:58:57