
Page 49 - Mathematics_Form_3
P. 49
Functions
6. h (t ) = t + 2t + 3 y
2
7. f (t ) = 2 − t Line 1 Line 2
2
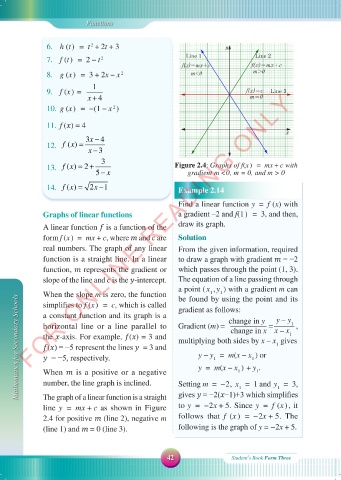
f(x)=mx+c f(x)=mx+c
8. g (x ) = 3 + 2x − x m<0 m>0
2
1
FOR ONLINE READING ONLY
9. f (x ) = f(x)=c Line 3
x + 4 m=0
10. g (x ) = − (1 − x )
2
11. f ( ) = 4
x
3x − 4
() =
12. fx
x − 3
3
() = +
13. fx 2 Figure 2.4: Graphs of f(x ) = mx + c with
5 x− gradient m <0, m = 0, and m > 0
14. fx = 2x − 1 Example 2.14
()
Find a linear function y = f (x) with
Graphs of linear functions a gradient ‒2 and f(1 ) = 3, and then,
A linear function is a function of the draw its graph.
form f (x ) = mx + c, where and are Solution
real numbers. The graph of any linear From the given information, required
function is a straight line. In a linear to draw a graph with gradient = −2
function, represents the gradient or which passes through the point (1, 3).
slope of the line and is the -intercept. The equation of a line passing through
a point ( x , y ) with a gradient m can
When the slope m is zero, the function be found by using the point and its
1
1
Mathematics for Secondary Schools horizontal line or a line parallel to Gradient (m) = change in y = _ ,
simplifies to f (x ) = c, which is called
gradient as follows:
a constant function and its graph is a
y – y
_
1
change in x x – x
the -axis. For example, ( ) = 3 and
1
multiplying both sides by x – x gives
1
( ) = −5 represent the lines = 3 and
y − y = m(x − x ) or
= −5, respectively.
1
1
y = m(x − x ) + y .
When is a positive or a negative
1
1
number, the line graph is inclined.
1
1
gives = −2( −1)+3 which simplifies
The graph of a linear function is a straight
to y = − 2x + 5. Since y = f (x ) , it
line y = mx + c as shown in Figure Setting m = − 2, x = 1 and y = 3,
2.4 for positive (line 2), negative m follows that f (x ) = − 2x + 5. The
(line 1) and = 0 (line 3). following is the graph of y = − 2x + 5.
42 Student\s Book Form Three
18/09/2025 09:58:55
MATHEMATIC F3 SB.indd 42
MATHEMATIC F3 SB.indd 42 18/09/2025 09:58:55