
Page 51 - Mathematics_Form_3
P. 51
Functions
7 _
x 0 − 3 7 . f (x ) = − x
4
y 3 0
8. f (x ) = 5 − x
The graph of f (x ) = x + 3 is as shown 1 _
in the following figure. 9 . f (x ) = x
2
FOR ONLINE READING ONLY
y 10. f (x ) = 5 + 2x
3 11. f (x ) = 4
2
f(x)=x+3
1 Graphs of quadratic functions
A quadratic function is a function of
-4 -3 -2 -1 0 1 2 x
-1 the form f ()x = ax + 2 bx + , c where
a, b, c are real numbers and ≠ 0.
-2
Some examples of quadratic functions
Domain { :xx= ∈ } and are f (x ) = 3 x + 2x + 1, f (x ) = x + 5,
2
2
and f (x ) = x .
2
range { :yy= ∈ } .
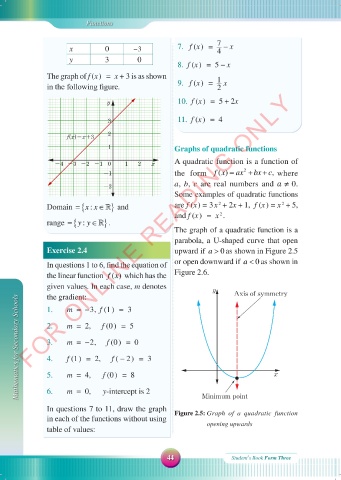
The graph of a quadratic function is a
parabola, a U-shaped curve that open
0
Exercise 2.4 upward if a > as shown in Figure 2.5
0
In questions 1 to 6, find the equation of or open downward if a < as shown in
the linear function ()fx which has the Figure 2.6.
given values. In each case, m denotes y Axis of symmetry
the gradient:
Mathematics for Secondary Schools 2 . m = 2, f (0 ) = 5 x
m = − 3, f (1 ) = 3
1 .
m = − 2, f (0 ) = 0
3 .
f (1 ) = 2, f ( − 2 ) = 3
4.
5.
m = 4 , f (0 ) = 8
m = 0 , y -intercept is 2
6.
In questions 7 to 11, draw the graph Minimum point
Figure 2.5: Graph of a quadratic function
in each of the functions without using
opening upwards
table of values:
44 Student\s Book Form Three
18/09/2025 09:58:56
MATHEMATIC F3 SB.indd 44 18/09/2025 09:58:56
MATHEMATIC F3 SB.indd 44