
Page 58 - Mathematics_Form_3
P. 58
Functions
Example 2.25
f (x ) = ⌊ ⌋ f (x ) = ⌈ ⌉
1 1 1 If G is a function defined by
1.3 1 2 G(x ) = ⌊x⌋ − x, where n ≤ x < n + 1,
0.5 0 1
4.2 4 5 draw the graph of G and then state its
FOR ONLINE READING ONLY
9.8 9 10 domain and range.
Solution
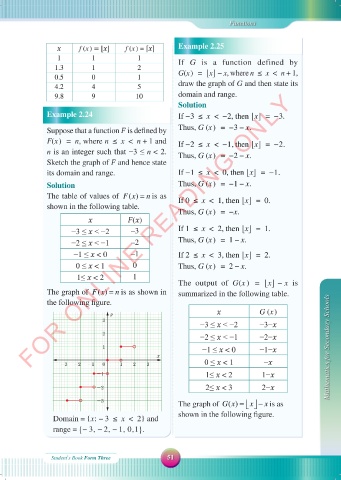
Example 2.24 If − 3 ≤ x < − 2 , then ⌊x⌋ = − 3 .
Suppose that a function is defined by Thus, G (x ) = − 3 − x .
F(x ) = n, where n ≤ x < n + 1 and If − 2 ≤ x < − 1, then ⌊x⌋ = − 2.
n is an integer such that −3 ≤ n < 2. Thus, G (x ) = − 2 − x .
Sketch the graph of and hence state
its domain and range. If − 1 ≤ x < 0, then ⌊x⌋ = − 1.
Solution Thus, G (x ) = − 1 − x .
The table of values of ()Fx = is as If 0 ≤ x < 1, then ⌊x⌋ = 0.
n
shown in the following table.
Thus, G (x ) = − x .
( )
−3 ≤ < −2 –3 If 1 ≤ x < 2, then ⌊x⌋ = 1.
−2 ≤ < −1 –2 Thus, G (x ) = 1 − x .
−1 ≤ < 0 –1 If 2 ≤ x < 3, then ⌊x⌋ = 2.
0 ≤ < 1 0 Thus, G (x ) = 2 − x .
1≤ < 2 1
The output of G(x ) = ⌊x⌋ − x is
n
The graph of ()Fx = is as shown in summarized in the following table.
the following figure.
y G (x )
3
−3 ≤ < −2 −3−
2 −2 ≤ < −1 −2−
1 −1 ≤ < 0 −1− Mathematics for Secondary Schools
x
-3 -2 -1 0 1 2 3 0 ≤ < 1 −
-1 1≤ < 2 1−
-2 2≤ < 3 2−
x − is as
-3
The graph of ()Gx = x
shown in the following figure.
Domain = {x : − 3 ≤ x < 2} and
range = {− 3, − 2, − 1, 0, 1} .
Student\s Book Form Three 51
18/09/2025 09:59:00
MATHEMATIC F3 SB.indd 51
MATHEMATIC F3 SB.indd 51 18/09/2025 09:59:00