
Page 157 - Mathematics_Form_Two
P. 157
Sets
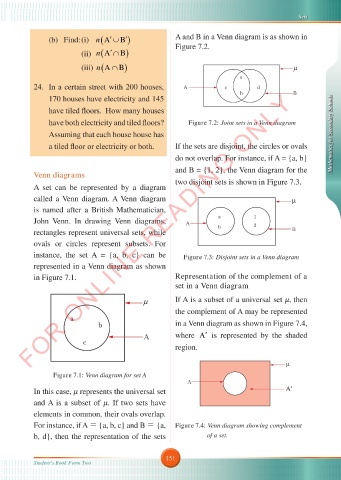
(b) Find: (i) (An ′ B′∪ ) A and B in a Venn diagram is as shown in
Figure 7.2.
(ii) (An ′∩ B )
(iii) (An ∩ B )
24. In a certain street with 200 houses,
FOR ONLINE READING ONLY
170 houses have electricity and 145
have tiled floors. How many houses
have both electricity and tiled floors? Figure 7�2: Joint sets in a Venn diagram
Assuming that each house house has Mathematics for Secondary Schools
a tiled floor or electricity or both. If the sets are disjoint, the circles or ovals
do not overlap. For instance, if A = {a, b}
and B = {1, 2}, the Venn diagram for the
Venn diagrams
A set can be represented by a diagram two disjoint sets is shown in Figure 7.3.
called a Venn diagram. A Venn diagram
is named after a British Mathematician,
John Venn. In drawing Venn diagrams,
rectangles represent universal sets, while
ovals or circles represent subsets. For
instance, the set A = {a, b, c} can be Figure 7�3: Disjoint sets in a Venn diagram
represented in a Venn diagram as shown
in Figure 7.1. Representation of the complement of a
set in a Venn diagram
If A is a subset of a universal set , then
the complement of A may be represented
in a Venn diagram as shown in Figure 7.4,
where A′ is represented by the shaded
region.
Figure 7�1: Venn diagram for set A
In this case, represents the universal set
and A is a subset of . If two sets have
elements in common, their ovals overlap.
=
=
For instance, if A {a, b, c} and B {a, Figure 7�4: Venn diagram showing complement
b, d}, then the representation of the sets of a set.
151
Student's Book Form Two
MATHEMATIC F2 v5.indd 151 11/10/2024 20:13:24
11/10/2024 20:13:24
MATHEMATIC F2 v5.indd 151