
Page 185 - Physics_Form_2
P. 185
Refraction and dispersion of light
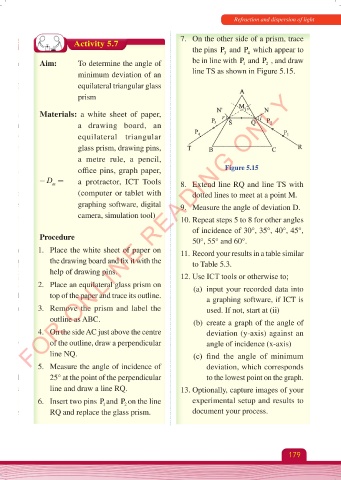
7. On the other side of a prism, trace
Activity 5.7
the pins P and P which appear to
3
4
Aim: To determine the angle of be in line with P and P , and draw
2
1
minimum deviation of an line TS as shown in Figure 5.15.
equilateral triangular glass
FOR ONLINE READING ONLY
prism
Materials: a white sheet of paper,
a drawing board, an
equilateral triangular
glass prism, drawing pins,
a metre rule, a pencil,
office pins, graph paper, Figure 5.15
i−r +e−r +180°− D = 180° a protractor, ICT Tools 8. Extend line RQ and line TS with
m
(computer or tablet with dotted lines to meet at a point M.
graphing software, digital 9. Measure the angle of deviation D.
camera, simulation tool)
10. Repeat steps 5 to 8 for other angles
of incidence of 30°, 35°, 40°, 45°,
Procedure 50°, 55° and 60°.
1. Place the white sheet of paper on 11. Record your results in a table similar
the drawing board and fix it with the to Table 5.3.
help of drawing pins. 12. Use ICT tools or otherwise to;
2. Place an equilateral glass prism on (a) input your recorded data into
top of the paper and trace its outline. a graphing software, if ICT is
3. Remove the prism and label the used. If not, start at (ii)
outline as ABC. (b) create a graph of the angle of
4. On the side AC just above the centre deviation (y-axis) against an
of the outline, draw a perpendicular angle of incidence (x-axis)
line NQ. (c) find the angle of minimum
5. Measure the angle of incidence of deviation, which corresponds
25° at the point of the perpendicular to the lowest point on the graph.
line and draw a line RQ. 13. Optionally, capture images of your
6. Insert two pins P and P on the line experimental setup and results to
1
2
RQ and replace the glass prism. document your process.
179
Physics Form 2 Final.indd 179 25/10/2025 10:28